Plots
This is a dashboard for the dashboard class.
Column
Scatter plot of bill length vs depth
Look at this awesome scatter plot!!
Column
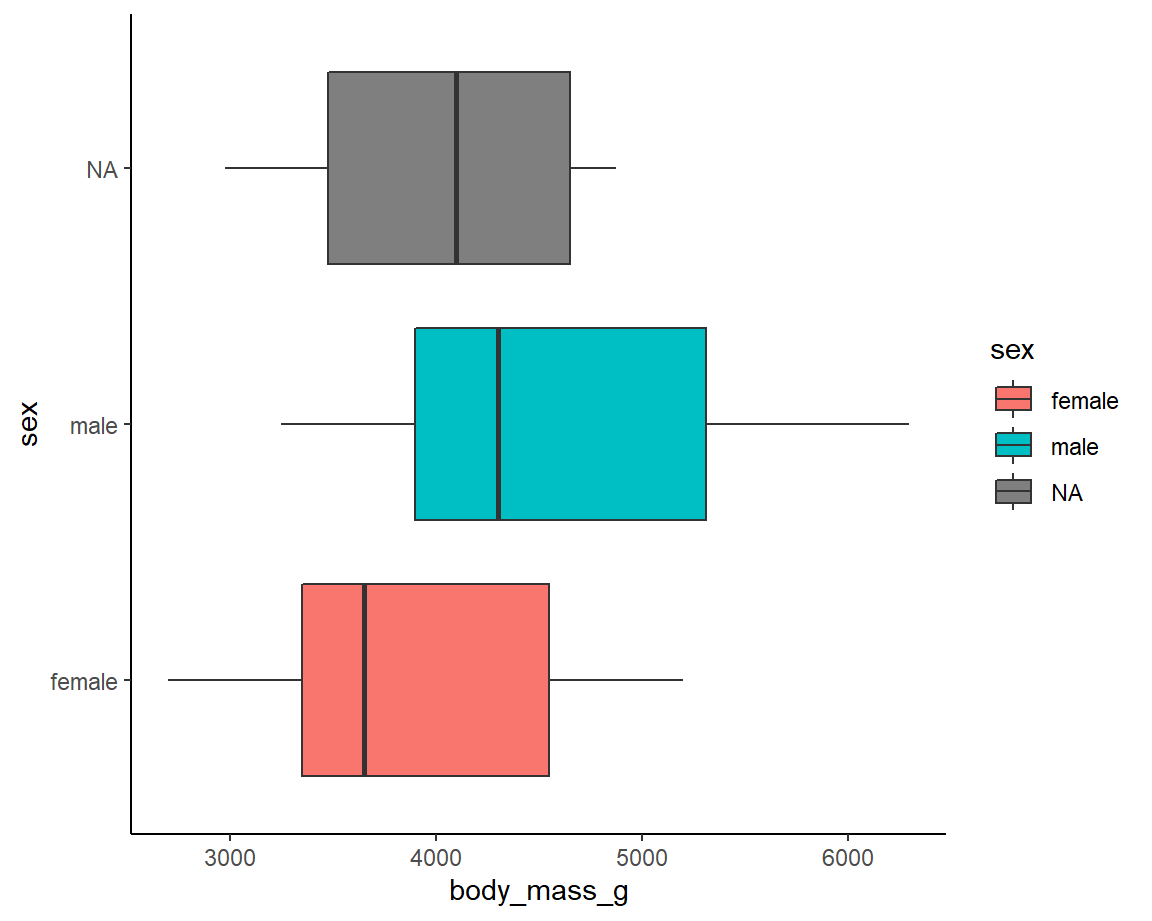
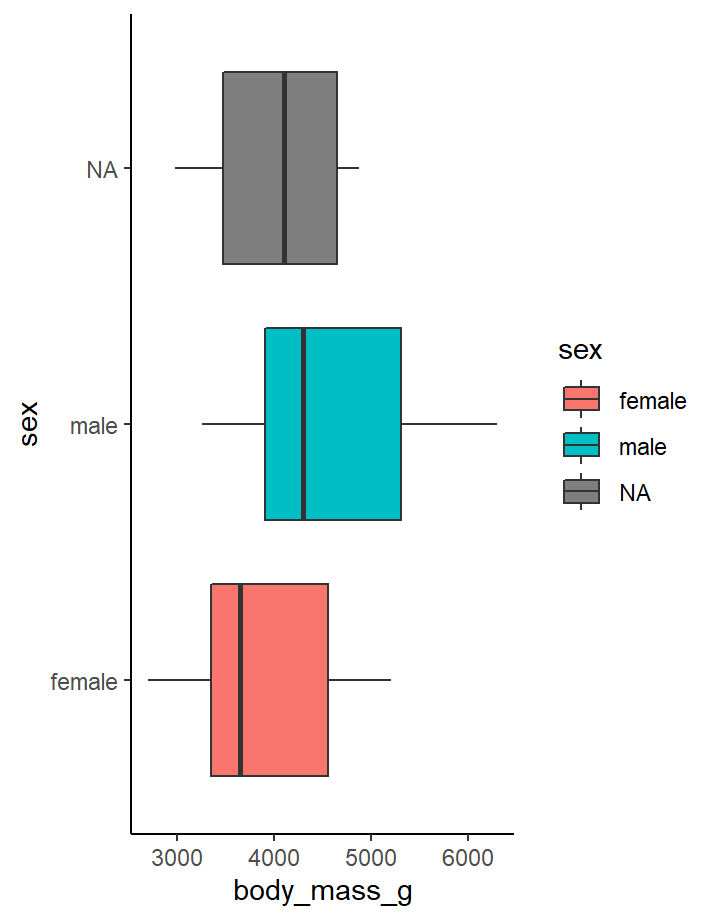
Box plot of body mass by sex
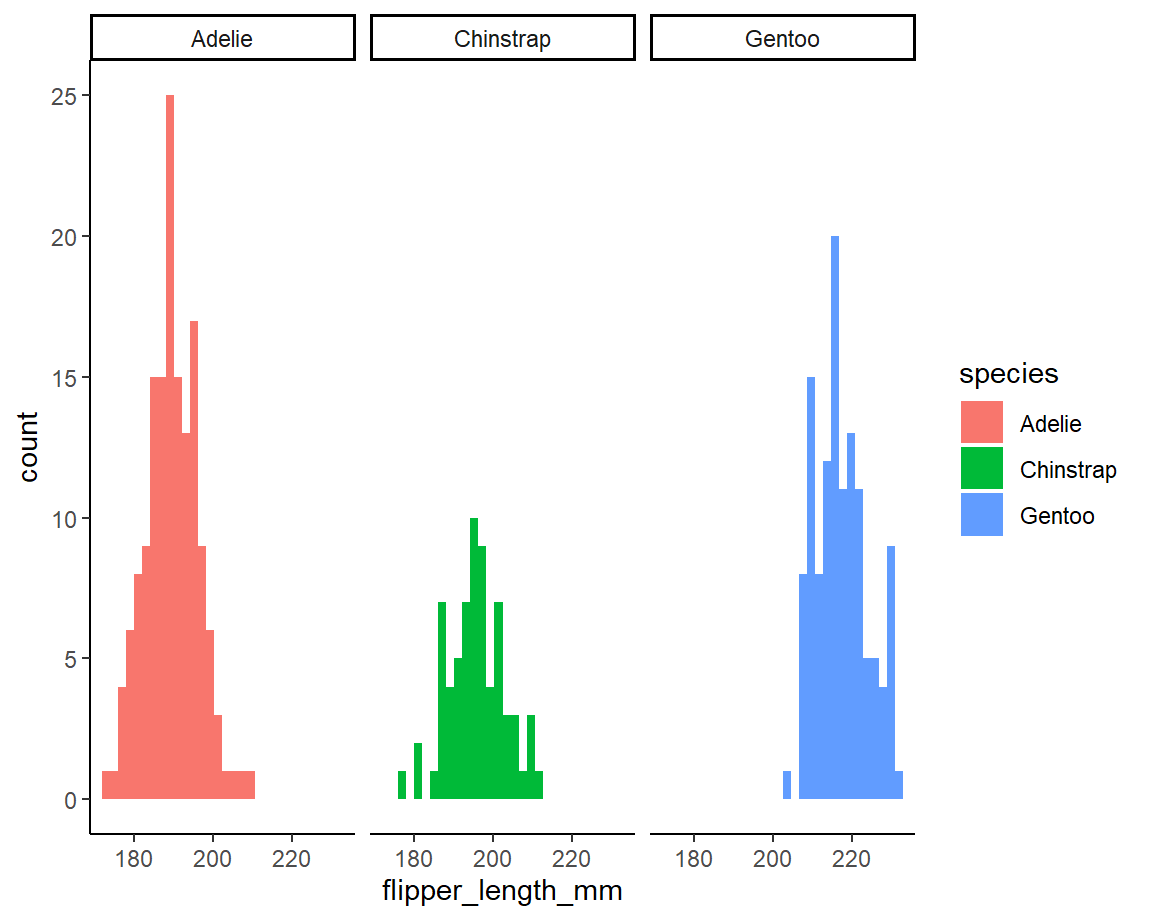
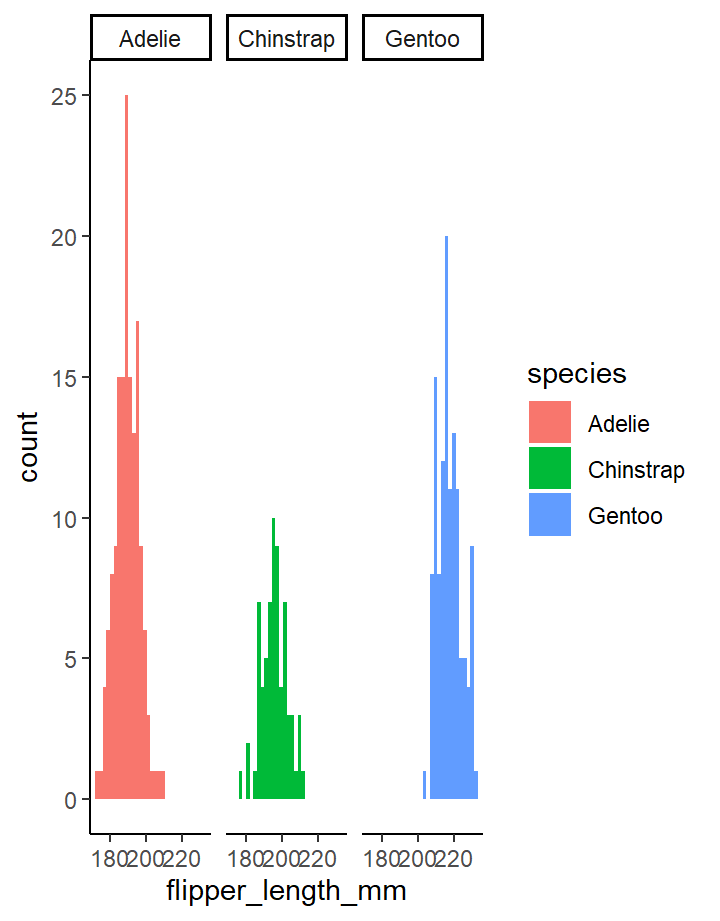
Histogram flipper length by species
This is a dashboard for the dashboard class.
Look at this awesome scatter plot!!
---
title: "Dahsboarding_Class"
output:
  flexdashboard::flex_dashboard:
    orientation: column
    vertical_layout: fill
    social: ["menu"]
    source_code: embed
---

```{r setup, include=FALSE}
library(flexdashboard)
library(tidyverse)
library(palmerpenguins)
data("penguins")
```

Plots
===============================================================
This is a dashboard for the dashboard class.

Column {data-width=650}
-----------------------------------------------------------------------

### Scatter plot of bill length vs depth

```{r}
a = penguins %>% ggplot(aes(x = bill_length_mm, y = bill_depth_mm,
                        color = species))+geom_point()+
  theme_classic()

plotly::ggplotly(a)
```
>Look at this awesome scatter plot!!


Column {data-width=350}
-----------------------------------------------------------------------

### Box plot of body mass by sex

```{r}
penguins %>% ggplot(aes(x = body_mass_g, y = sex, fill = sex))+
  geom_boxplot()+theme_classic()
```

### Histogram flipper length by species

```{r}
penguins %>% ggplot(aes(x = flipper_length_mm, fill = species))+
  geom_histogram()+facet_wrap(~species)+theme_classic()
```

Data
=================================================================
```{r}
DT::datatable(penguins)
```